Benchmarking Studies in Transfer Pricing
Introduction
Benchmarking is the backbone of transfer pricing (TP). It provides independent market evidence that related-party prices or margins are arm’s length—which is the core requirement under OECD Guidelines and the UAE Corporate Tax regime (Federal Decree-Law No. 47 of 2022). A well-executed benchmarking study reduces audit risk, avoids penalties, and brings clarity to pricing policies across the group.
________________________________________
1) What is a Benchmarking Study?
A benchmarking study identifies comparable uncontrolled transactions (or companies) and derives an arm’s length range of prices or profit indicators. Your related-party results are then tested against this range. In practice, benchmarking supports:
• Pricing for intercompany goods (buy–sell/distribution)
• Services (management, IT, support)
• Intra-group financing (interest rates, guarantees)
• IP licensing/royalties (rates and bases)
• Contract manufacturing and tolling arrangements
________________________________________
2) When do UAE businesses need it?
• You have material related-party cross-border dealings
• You must prepare a Local File/Master File (when prescribed thresholds apply)
• The FTA requests contemporaneous documentation
• You’re implementing/renewing an APA or defending an audit
________________________________________
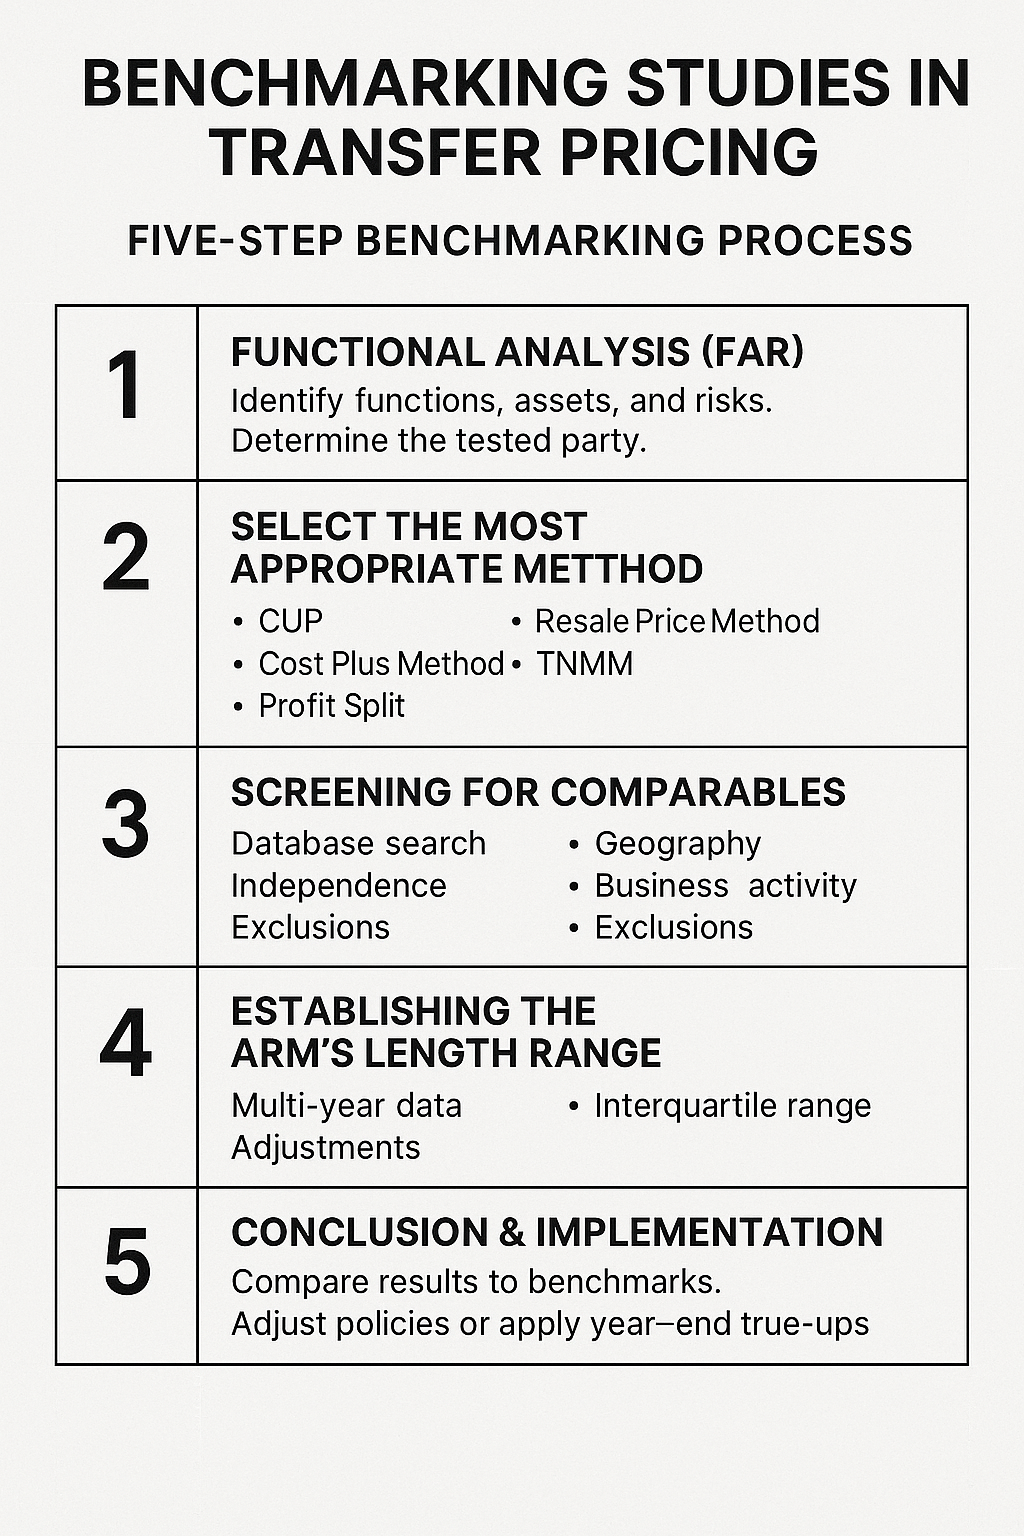
3) Core Methodology—Step by Step
Step A: Delineate the Controlled Transaction
• Map who does what, uses which assets, and assumes which risks (FAR analysis).
• Confirm the tested party: the entity with the simpler functions and limited intangibles/risks (often the distributor or contract manufacturer).
Step B: Select the “Most Appropriate Method”
• CUP (Comparable Uncontrolled Price) – strongest for commodities/royalties.
• Resale Price Method – limited-risk distributors.
• Cost Plus Method – routine service providers/contract manufacturers.
• TNMM – most common; tests a profit level indicator (PLI) such as:
o Operating Margin (OP/OR)
o Return on Costs (OP/OC)
o Berry Ratio (Gross Profit/Operating Expenses) for limited-risk distributors/services
o Return on Capital Employed (ROCE) where asset intensity is key
• Profit Split – integrated operations or unique intangibles on both sides.
Step C: Build a Comparable Set (Database Screening)
Use reputable databases (e.g., Orbis, Bloomberg, RoyaltyStat, ktMINE). Apply objective filters:
• Geography: UAE / GCC / Middle East–Africa; expand to broader EMEA only if needed.
• Status: Independent, active, non-governmental, non-consolidated.
• Size: Reasonable revenue/asset bands to exclude micro or outlier giants.
• Qualitative screening:
o Match business model (e.g., wholesale distributor vs. retailer)
o Exclude own-brand/entrepreneurial companies if testing a limited-risk distributor
o Remove entities with persistent losses, distress, or extraordinary events
o Check for R&D/marketing intangibles that don’t match the tested party
Step D: Compute the Arm’s Length Range
• Use multi-year data (typically 3 years) to smooth volatility.
• Calculate the PLI for each comparable, remove statistical outliers, and apply the interquartile range (IQR: 25th–75th percentiles).
• Consider comparability adjustments where relevant:
o Working capital (receivables, payables, inventory)
o Capacity utilisation differences
o Accounting reclassifications (e.g., operating vs. non-operating items)
Step E: Conclude & Implement
• Compare the tested party’s actual results to the arm’s length range.
• Policy outcome examples:
o Distribution: set a target OP/OR of, say, 3.5%–6.5% (IQR example).
o Services: charge cost plus 5%–8% based on routine support services.
o Loans: set an arm’s length interest rate using credit rating/tenor curves.
• Document any true-up/true-down mechanism before year-end.
________________________________________
4) Special Topics (UAE-relevant)
a) Free Zone Entities (FZEs/FZCOs)
• If claiming Qualifying Income under Free Zone rules, ensure related-party pricing is arm’s length—or you risk disqualification. Benchmarking supports substance and arm’s length outcomes.
b) Commodity & Jewellery Sector
• Where CUP exists (e.g., LME for metals), CUP often prevails. For downstream distribution, TNMM with Berry Ratio or OP/OR may be appropriate if inventory risk is limited.
c) Management/Head-Office Charges
• Apply the benefit test and maintain time-writing / allocation keys. Benchmark cost-plus mark-ups against routine support-service studies, not high-value advisory.
d) Intra-Group Financing
• Align with credit rating, tenor, currency, collateral/guarantees. Use internal/external comparables and consider implicit support.
e) Intangibles & Royalties
• Start with CUP (license databases). Cross-check with profit-split/TNMM where returns to intangibles are shared.
________________________________________
5) What Goes into a Benchmarking Report?
• Executive summary & conclusion
• Group overview, industry analysis
• Detailed FAR and tested party selection
• Method choice & PLI rationale
• Search strategy, quantitative filters, qualitative screening notes
• Comparable financials, adjustments, IQR calculations
• Sensitivity checks (single-year vs. multi-year; with/without certain comparables)
• Pricing policy and year-end adjustment mechanism
• Compliance mapping to Local File/Master File requirements
________________________________________
6) Quality Pitfalls to Avoid
• Treating global giants or brand-owners as comparables for a limited-risk entity
• Mixing retail with wholesale distributors
• Ignoring working capital differences
• Using single-year data in a volatile market without explanation
• Blind “database dumps” without qualitative review
• Copy-pasting foreign ranges without regional reality checks
________________________________________
7) Refresh & Maintenance
• Annual update of financials to monitor compliance during the year.
• Full refresh (search & screening) every 3 years or when business model/market changes.
• Maintain contemporaneous documentation—ready to share with the FTA upon request.
________________________________________
8) Illustrative Example (TNMM – Limited-Risk Distributor)
• Tested party: UAE distributor, no marketing intangibles, routine risks
• PLI: Operating Margin (OP/OR)
• Result of screening: 10 comparables; after outlier removal, IQR = 3.2% – 6.8%
• Tested party projected OP/OR: 5.1% → Compliant (within IQR)
• Pricing policy: quarterly monitoring; year-end true-up if margin <3.2%
________________________________________
9) Practical Checklist (Save This)
• Clear FAR and tested party
• Right method & PLI
• Transparent search filters + qualitative screening
• Multi-year analysis + IQR
• Adjustments (working capital/capacity)
• Policy & true-up mechanism
• Map to Local File and Master File
________________________________________
How We Can Help
Benchmarking Studies (distribution, services, manufacturing, financing, royalties)
Local File / Master File preparation
Intra-group policy design & year-end true-ups
APA feasibility and submissions
FTA audit support & defence files
________________________________________
Sheikh Anwar Accounting & Auditing LLC
MOE Registered Auditor – Entry No. 5817 · Company Entry No. LC4695-01
🌐 www.sa-auditors.com ·
✉️ info@sa-auditors.com ·
📱 +971-XX-XXXXXXX